When researching foreign market size, using free international statistics databases is the most efficient approach. By choosing the right database among UNIDO, World Bank, UN Comtrade, and four others, you can grasp the full picture of a market before purchasing expensive paid reports.
"We're considering overseas expansion, but first we need to understand the market size in numbers."
"We want data to decide whether it's worth buying a paid market research report."
For situations like these, the free statistics databases published by the United Nations and World Bank are invaluable. In this article, I explain how to use the seven databases that I rely on daily in my overseas market research work.
Choose the Right Database for Your Purpose
UNIDO for manufacturing industry size, World Bank for macroeconomic data, UN Comtrade for trade flows. The best database depends on what you want to find out.
Start by getting the big picture. The table below shows the basic framework for choosing the right database.
| What You Want to Know | Database | What You Can Find |
|---|---|---|
| Compare industry size by country for a specific sector | UNIDO INDSTAT | Value added, output, employment (breakable into 24 industries by ISIC classification) |
| Macro-level comparison of manufacturing sectors | World Bank | GDP, manufacturing value added (multiple countries in one API call) |
| Trade values by product category | UN Comtrade | Trade values by HS code or SITC code |
| Agricultural production and food trade | FAOSTAT | Agricultural output, food supply, agri-trade (245 countries, from 1961) |
| Economic indicators within ASEAN | ASEAN Stats | Trade, investment, economic indicators for all 10 member states (ASEAN Secretariat official) |
| Economic indicators for Asia-Pacific | ADB Key Indicators | GDP, industrial composition, investment for 49 Asian economies |
| Not sure which database to use | UNdata | A portal that searches across multiple UN databases |
UNIDO INDSTAT Is the Most Accurate Database for Comparing Industry Size
UNIDO's INDSTAT uses ISIC (International Standard Industrial Classification) codes to break down manufacturing data for 153 countries into 24 industries. It is the single most important database for industrial research.
Available Data
| Indicator | Description |
|---|---|
| Output | Product shipment value |
| Value added | Output minus intermediate inputs. Shows the true "strength" of an industry |
| Establishments | Number of factories in that industry in each country |
| Employees | Number of workers |
| Wages and salaries | Total labor costs |
| Gross fixed capital formation | Investment in factories and equipment |
Coverage spans 153 countries, from 1981 to 2023. Free and no registration required.
ISIC Classification Examples (Food-Related)
Industries are specified by 2-digit ISIC codes. Further breakdown to 4-digit level is also possible.
| ISIC Code | Description |
|---|---|
| 10 | Food products |
| 11 | Beverages |
| 20 | Chemicals |
| 22 | Rubber and plastics |
| 27 | Electrical equipment |
| 28 | General-purpose machinery |
ISIC 10 (Food products) breaks down further at the 4-digit level: 1010 for meat processing, 1020 for fish processing, 1040 for vegetable and animal oils, 1050 for dairy products, and 1061 for grain mill products.
How to Access
For web-based access, go to https://stat.unido.org/data/table and select the country, ISIC code, and indicator. CSV download is also supported.
An API is available, but it retrieves data one country at a time. For multi-country comparisons, the web interface or bulk download (https://stat.unido.org/data/download) is more efficient.
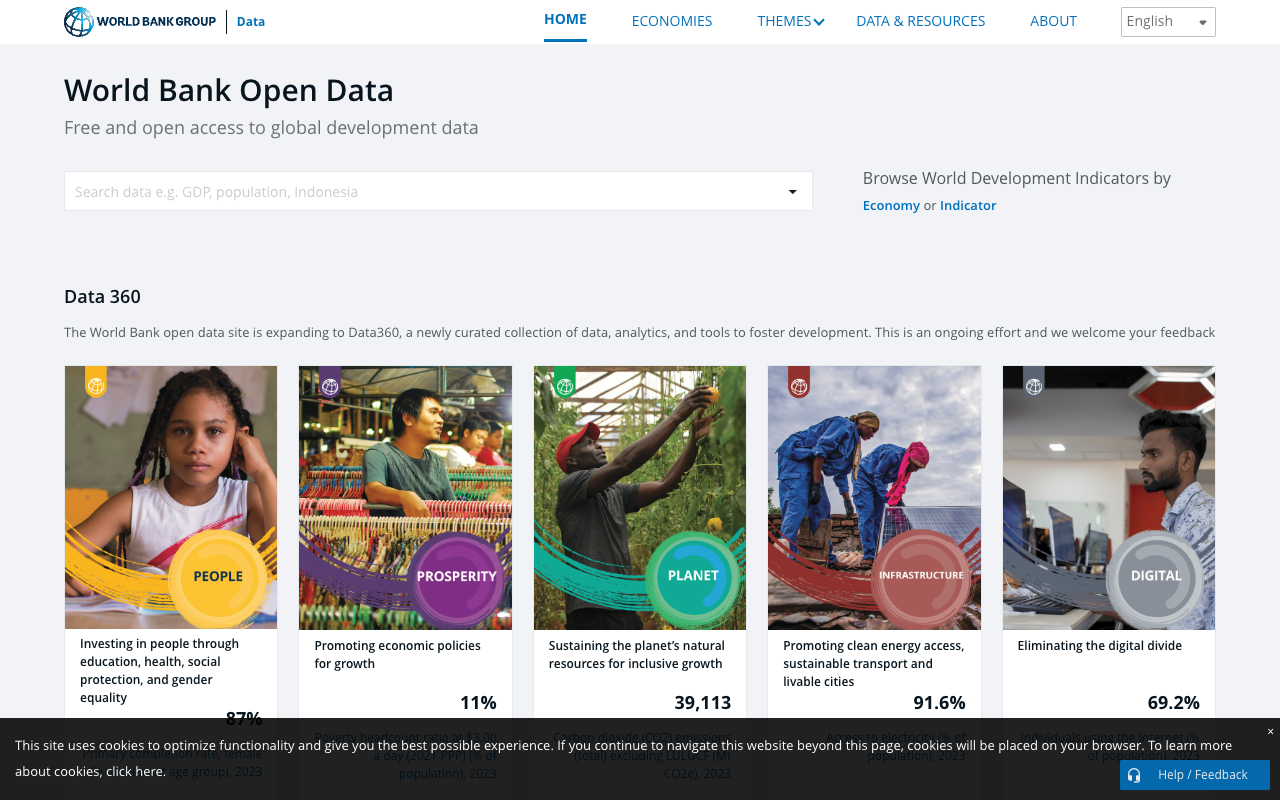
World Bank API Gives You a Macro Comparison in 5 Minutes
World Bank Open Data has an exceptionally user-friendly API that retrieves manufacturing value added and GDP for multiple countries in a single request. It is ideal for getting a quick overview.
Commonly Used Indicator Codes
| Indicator Code | Description |
|---|---|
| NV.IND.MANF.CD | Manufacturing value added (USD) |
| NV.MNF.FBTO.ZS.UN | Food, beverages, and tobacco as % of manufacturing VA |
| NY.GDP.MKTP.CD | GDP (USD) |
| SP.POP.TOTL | Population |
API Call Example
To retrieve manufacturing value added for five ASEAN countries, simply paste the following URL into your browser:
Separate country codes with semicolons to get data for multiple countries in one call. Use `format=json` for JSON output and `date=2020:2024` to specify the year range.
API documentation is available at https://datahelpdesk.worldbank.org/knowledgebase/articles/889392.
World Bank vs. UNIDO: When to Use Which
| Comparison | UNIDO INDSTAT | World Bank |
|---|---|---|
| Industry granularity | ISIC 2-digit to 4-digit (24+ industries) | "Food, beverages, and tobacco" grouped as one |
| Available indicators | Output, value added, employment, establishments, capital investment, wages | Manufacturing VA share (%) only |
| API | Available but one country at a time | Multiple countries in one request |
| Ease of use | Somewhat complex | Simple |
Use UNIDO for detailed industry-level analysis. Use World Bank for quick country-level macro comparisons.
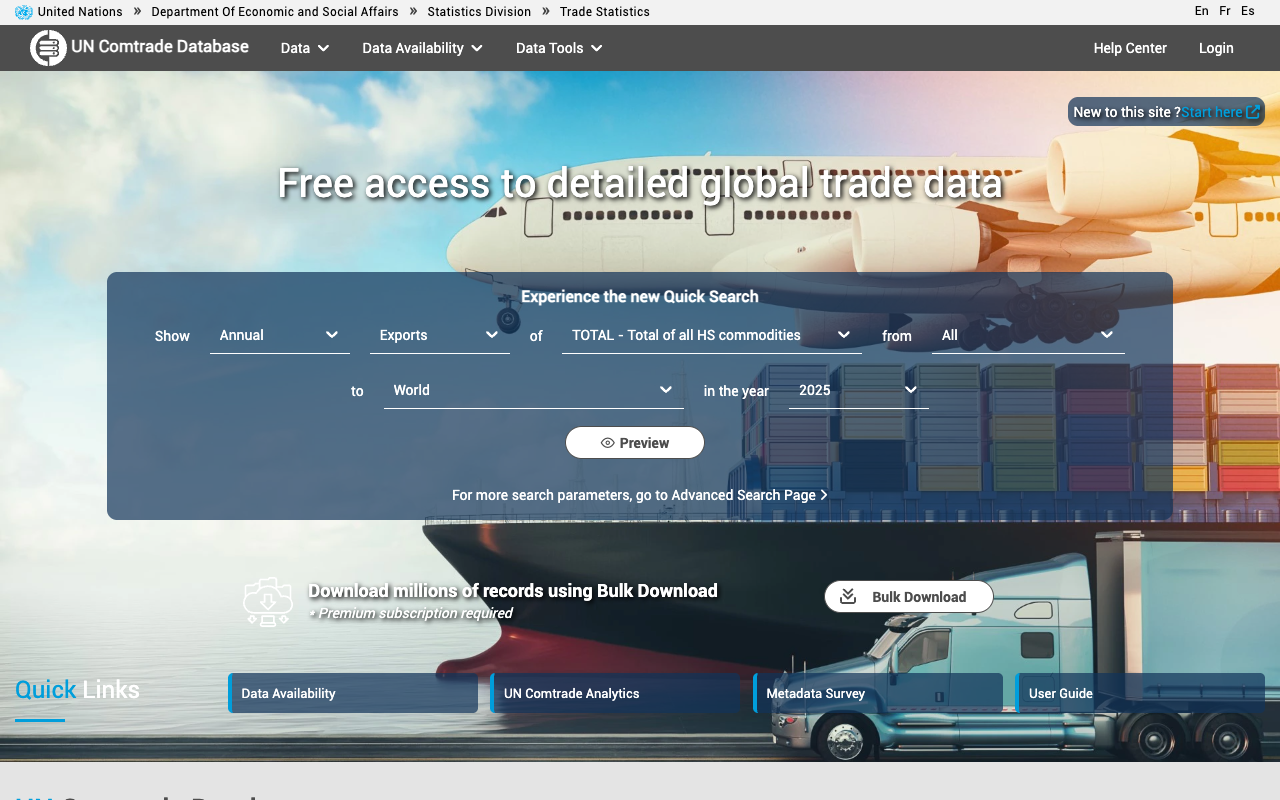
UN Comtrade Shows "What Does This Country Export?"
The UN's international trade statistics database, UN Comtrade, lets you retrieve import/export values by specifying products using HS codes (customs classification). It is for investigating trade structure, not domestic industry size.
While UNIDO shows "the size of domestic manufacturing," UN Comtrade shows "what and how much a country is importing and exporting." These serve different purposes, so do not confuse them.
Product Classification
- HS codes (6 digits) allow fine-grained product specification. For example, HS 1902 covers "pasta and noodles"
- SITC codes are suited for broader category comparisons
HS Code Examples (Food-Related)
| HS Code | Description |
|---|---|
| 02 | Meat |
| 03 | Fish and seafood |
| 04 | Dairy products and eggs |
| 16 | Prepared meat and fish |
| 19 | Cereal preparations, bread, pastry |
| 20 | Prepared vegetables and fruit |
| 21 | Miscellaneous edible preparations |
The web interface is at https://comtradeplus.un.org/. An API is also available (the free version has hourly request limits). For Python users, install the official library with `pip install comtradeapicall`.
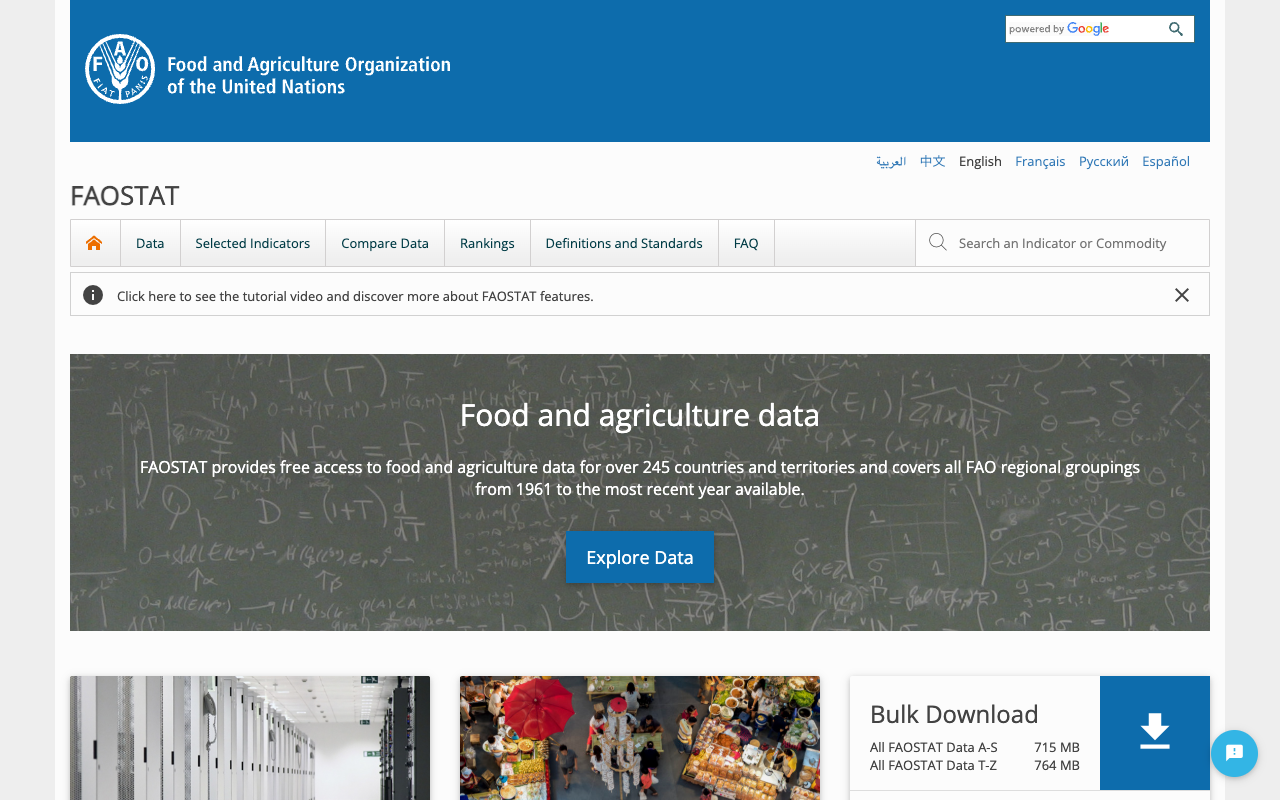
FAOSTAT Covers the Agricultural Side, UNIDO Covers the Manufacturing Side
FAOSTAT, from the Food and Agriculture Organization (FAO), contains agricultural output, food supply, and agri-trade data for 245 countries. Use it when you need data on agriculture and raw materials.
In a nutshell: if you want rice production volume, use FAOSTAT. If you want instant noodle manufacturing value, use UNIDO.
| Comparison | FAOSTAT | UNIDO INDSTAT |
|---|---|---|
| Coverage | Agriculture (raw materials, primary products) | Manufacturing (processed food production) |
| Data examples | Rice production, beef exports | Food processing industry value added, employment |
| Countries | 245 | 153 |
| Starting year | 1961 | 1981 |
The web interface is at https://www.fao.org/faostat/. CSV download is supported.
(Note: In our overseas market research, we combine FAOSTAT and UNIDO when investigating food manufacturers in ASEAN countries. By examining both the raw material supply side and the manufacturing processing side, we can understand the structure of a country's food industry.)
ASEAN Stats and ADB Key Indicators Are Asia-Focused Statistics Portals
ASEAN Stats, operated by the ASEAN Secretariat, enables side-by-side comparison of all 10 member states. ADB Key Indicators from the Asian Development Bank covers 49 economies across Asia-Pacific.
ASEAN Stats
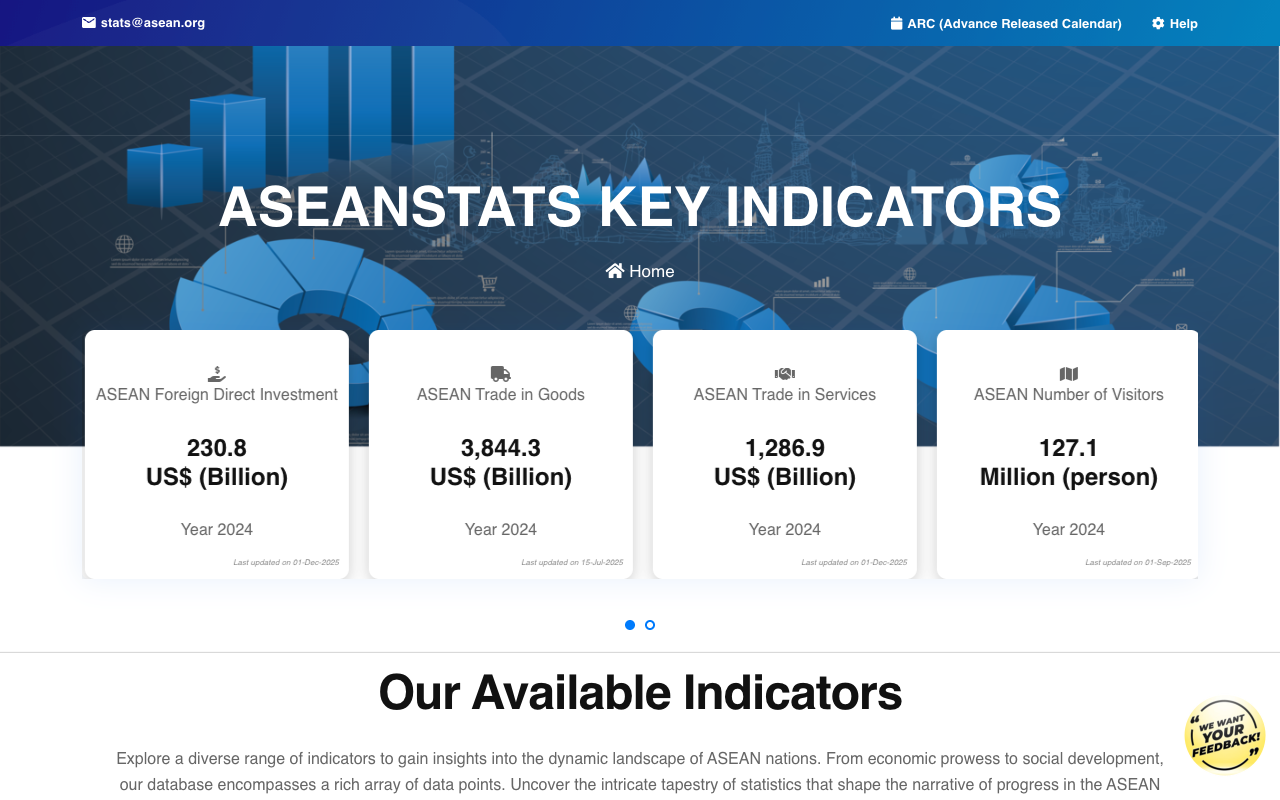
- URL: https://data.aseanstats.org/
- Content: Trade, investment, economic indicators, population
- Coverage: 10 ASEAN member states
Because it specializes in intra-ASEAN comparisons, it offers ASEAN-specific indicators (intra-regional trade ratios, FDI inflows, etc.) that are more detailed than what World Bank provides.
ADB Key Indicators
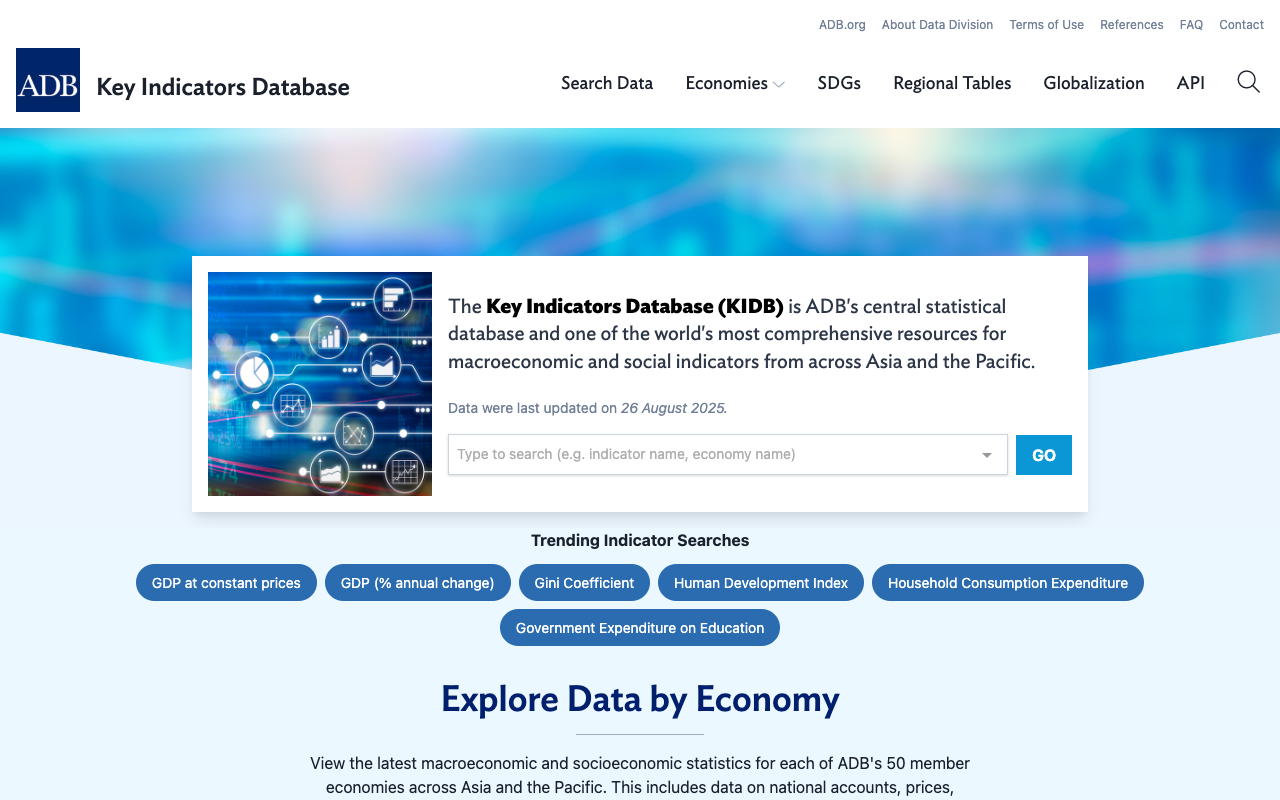
- URL: https://kidb.adb.org/
- Content: GDP, industrial composition, trade, investment, population, education
- Coverage: 49 economies across Asia-Pacific
Because it focuses on Asia, it also has strong coverage of South Asian countries such as India, Bangladesh, and Pakistan.
UNdata Is Your Starting Point When You Don't Know Which Database to Use
UNdata (https://data.un.org/) is a portal site that lets you search across multiple UN databases including UNIDO, Comtrade, and SNA (System of National Accounts).
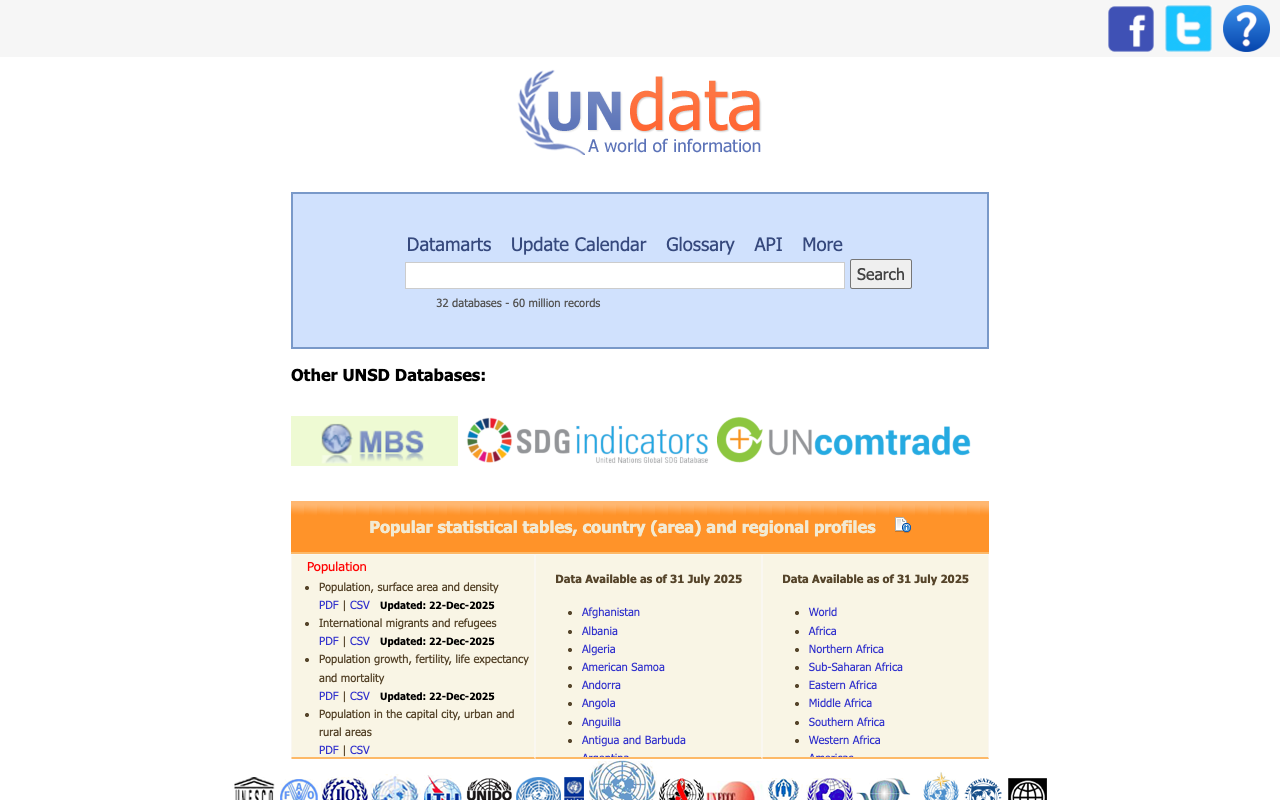
If you are not yet familiar with the specific databases, start with UNdata. It will show you which database contains the data you need. Once you become comfortable, accessing each database directly is more efficient.
Practical Workflow — Assess ASEAN Food Manufacturing Market Size in 30 Minutes
The following four steps allow you to assess the food manufacturing industry size in ASEAN countries using only free data. I show actual data retrieved from World Bank API and UNIDO INDSTAT.
Step 1 — Macro Comparison with World Bank API (5 min)
Retrieve manufacturing value added and food sector ratios.
| Country | Manufacturing VA (2024) | Food Ratio | Food Manufacturing VA (est.) |
|---|---|---|---|
| Indonesia | $265.1B | 28.1% (2022) | ~$74.5B |
| Philippines | $72.4B | 33.7% (2022) | ~$24.4B |
| Thailand | $128.1B | 17.5% (2021) | ~$22.4B |
| Vietnam | $116.4B | 11.5% (2022) | ~$13.4B |
| Malaysia | $95.0B | 10.9% (2022) | ~$10.4B |
This table is calculated from World Bank API indicator codes `NV.IND.MANF.CD` and `NV.MNF.FBTO.ZS.UN`.
Step 2 — Detailed Industry Breakdown with UNIDO INDSTAT (10 min)
Specify ISIC 10 (Food products) to retrieve value added, number of establishments, and employment. This lets you break down the "food" category that World Bank groups together into 4-digit sub-sectors.
Step 3 — Understand Trade Structure with UN Comtrade (15 min)
Search food-related HS codes (02-21) for import/export values. This reveals whether a country is a net exporter or importer of food products, which informs your market entry strategy (export hub vs. local consumption).
Step 4 — Proceed to Company-Level Research (Separate)
After grasping the market overview through macro data, move on to company-level research using stock exchange data, corporate IR filings, and government business registration databases in each country.
(Note: Our firm has conducted market research across 80+ countries. We also provide consultation on company-level research. See the end of this article for details.)
Summary — Choosing the Right Database Determines Your Research Efficiency
When investigating a foreign market, the first thing to do is clarify "what exactly you want to know" and select the database that matches.
| What You Want to Know | Best Database | Estimated Time |
|---|---|---|
| Quick country-level comparison | World Bank | 5 min |
| Industry size for a specific sector | UNIDO INDSTAT | 10-30 min |
| Trade values by product | UN Comtrade | 15 min |
| Agricultural and food production | FAOSTAT | 10 min |
| Detailed ASEAN-specific indicators | ASEAN Stats | 10 min |
| Economic indicators for Asia overall | ADB Key Indicators | 10 min |
Before purchasing paid market research reports ($3,000-$15,000 per report), I recommend using these free databases to get an overview of the market. Once you have the big picture, you can make better decisions about which paid reports are worth the investment.
If you would like to learn more about sizing overseas markets or building company lists for specific countries and industries:
Our firm conducts market research and company research across 80+ countries, with a focus on ASEAN, China, and India. We handle requests such as "I need to know the major players in the XX industry in this country" and "I need data to support market size estimates."
For service details and inquiries:
https://taitonmai.co.jp
Sources
- United Nations Industrial Development Organization (UNIDO), "INDSTAT Industrial Statistics Database," https://stat.unido.org/
- World Bank, "World Bank Open Data," https://data.worldbank.org/
- World Bank, "Data Help Desk - API Basic Call Structures," https://datahelpdesk.worldbank.org/knowledgebase/articles/889392
- United Nations Statistics Division, "UN Comtrade Database," https://comtradeplus.un.org/
- Food and Agriculture Organization (FAO), "FAOSTAT," https://www.fao.org/faostat/
- ASEAN Secretariat, "ASEANstats Data Portal," https://data.aseanstats.org/
- Asian Development Bank (ADB), "Key Indicators Database," https://kidb.adb.org/
- United Nations Statistics Division, "UNdata," https://data.un.org/
Need ASEAN market intelligence?
Custom company research starting from $2,000.
(Western consultancies charge $10,000–50,000 for similar work.)
- ✓ 350+ projects completed across 80+ countries
- ✓ Delivered in 2–4 weeks
- ✓ Pay only for what you need — no retainer required
Overseas Market Research & Company List Building
Free initial consultation. Tell us about your research needs.